IC Markets Home Sign in Web Trader Contact Us
IC Markets Social IC Markets Social

Information Hub for
Serious Traders

  • ABOUT US
  • OPEN LIVE ACCOUNT
  • OPEN DEMO ACCOUNT
  • TRADE NOW
  • VISIT OUR BLOG
IC Markets Social
  • ABOUT US
  • OPEN LIVE ACCOUNT
  • OPEN DEMO ACCOUNT
  • TRADE NOW
  • VISIT OUR BLOG
February 1, 2022North_American_Stocks_esIC Markets

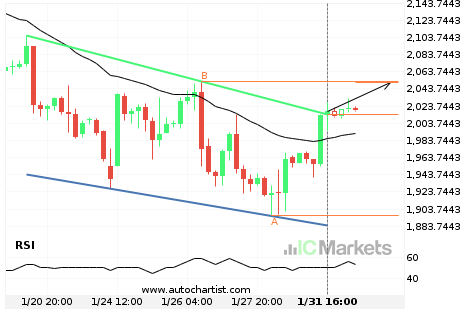
La línea de resistencia ha sido irrumpida por el US Small Cap 2000 Index

El US Small Cap 2000 Index ha atravesado la línea de resistencia, que ya se ha probado dos veces en el pasado. Hemos visto, anteriormente, un retroceso desde esta posición, así que debemos esperar la confirmación de la ruptura antes de operar. Si esta nueva tendencia persiste, un nivel objetivo alrededor de 2051.3983 podría materializarse […]

Read more
January 31, 2022North_American_Stocks_esIC Markets

El Amazon.Com Inc. está en dirección down

El Amazon.Com Inc. ha experimentado un excepcional movimiento descendente de un 18,11% de 3.394,402 a 2.804 en 34 días.

Read more
January 28, 2022North_American_Stocks_esIC Markets

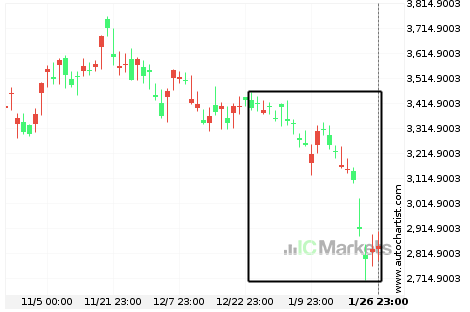
¿Hacia dónde se dirige el Amazon.Com Inc.?

Un movimiento de un 17,28% en 32 días de Amazon.Com Inc. no pasa desapercibido. Puede empezar a considerar hacía donde se dirigirá ahora: si seguirá con la tendencia descendente actual o volverá a la dirección anterior.

Read more
January 27, 2022North_American_Stocks_esIC Markets

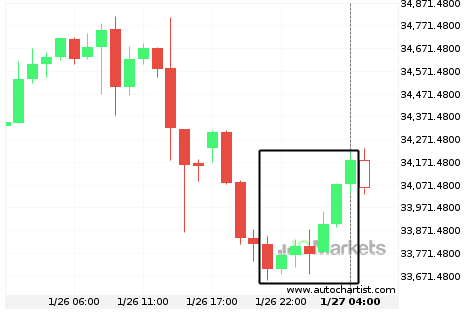
¿Hacia dónde se dirige el US Wall Street 30 Index?

Un movimiento de un 1,42% en 7 horas de US Wall Street 30 Index no pasa desapercibido. Puede empezar a considerar hacía donde se dirigirá ahora: si seguirá con la tendencia ascendente actual o volverá a la dirección anterior.

Read more
January 26, 2022North_American_Stocks_esIC Markets

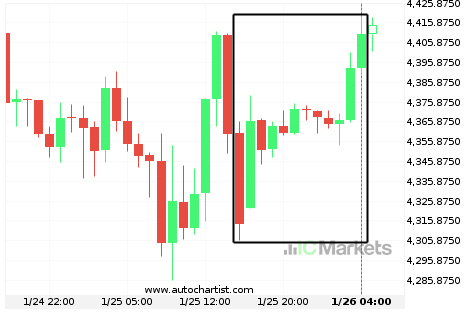
El US SPX 500 Index está en dirección up

El US SPX 500 Index ha experimentado un excepcional movimiento ascendente de un 2,22% de 4.360,2 a 4.409,9 en 13 horas.

Read more
January 25, 2022North_American_Stocks_esIC Markets

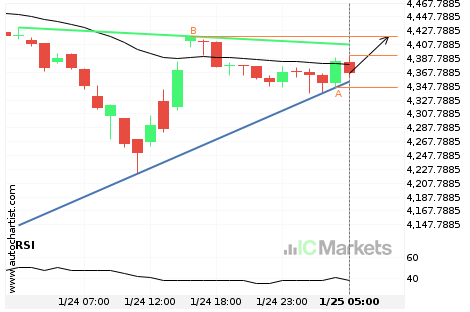
Posible ruptura del nivel de resistencia en el US SPX 500 Index

El US SPX 500 Index avanza hacia la línea de resistencia de un Triángulo, que ya ha probado varias veces en el pasado. Hemos visto un retroceso antes desde esta línea, así que en esta etapa no está claro si atravesará esta línea o se recuperará como lo ha hecho anteriormente. Si el US SPX […]

Read more
January 21, 2022North_American_Stocks_esIC Markets

Extraordinario movimiento bajista del Microsoft Corporation

El Microsoft Corporation ha descendido un 9,59% de 341,58 a 309,53 en 23 días.

Read more
January 20, 2022North_American_Stocks_esIC Markets

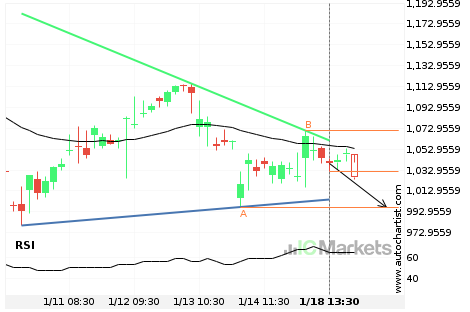
Se espera la posibilidad de un gran movimiento en el Tesla Motors Inc.

El Tesla Motors Inc. ha atravesado una línea de soporte de un Triángulo y sugiere un movimiento posible a 966.5027 dentro de las próximas 10 horas. Ya ha probado esta línea en el pasado, por lo que deberíamos esperar la confirmación de esta irrupción antes de entrar en acción. Si dicha ruptura no se confirma, […]

Read more
January 19, 2022North_American_Stocks_esIC Markets

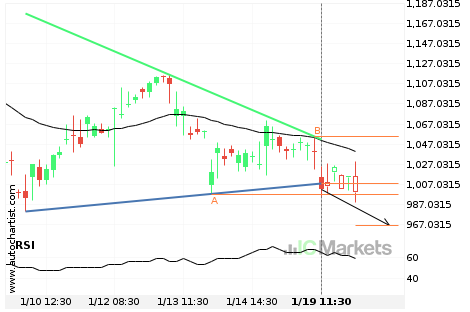
Inminente recuperación o irrupción del Tesla Motors Inc.

El Tesla Motors Inc. se dirige a la línea de soporte de un Triángulo. Si este movimiento se mantiene, el precio de Tesla Motors Inc. podría probar el nivel de 997.5900 en las próximas 10 horas. Ya ha probado esta línea en numerosas ocasiones, por lo que este movimiento podría durar poco y terminar recuperándose, […]

Read more
January 18, 2022North_American_Stocks_esIC Markets

US Small Cap 2000 Index – acercándose a el soporte del Cuña descendente

El US Small Cap 2000 Index avanza hacia una línea de soporte. Como le hemos visto retroceder desde esta línea anteriormente, podríamos presenciar, o bien, una ruptura a través de esta línea o una recuperación a los niveles actuales. Ha llegado a esta línea en numerosas ocasiones en los últimos 8 días y puede probarla […]

Read more
  • 1
  • 2
  • 3
  • …
  • 65
  • 66
  • 67
  • 68
  • 69
  • 70
  • 71
  • …
  • 89
  • 90
  • 91

Recent Posts

  • US Wall Street 30 Index – المستوى الرئيسي – مقاومة
  • Brent Oil vs US Dollar – نموذج الرسم البياني – قناة صاعدة
  • Brent Oil vs US Dollar – نموذج الرسم البياني – قناة صاعدة
  • Hong Kong 50 Index – نموذج الرسم البياني – مثلث صاعد
  • Hong Kong 50 Index – รูปแบบกราฟ – สามเหลี่ยมขาขึ้น

Recent Comments

    Translation


     Edit Translation

    Trade with

    a market leader you can rely on

    Open Trading Account Try a Free Demo

    Forex Trading

    • Accounts Overview
    • Open an Account
    • Launch Web Trader

    Trading Specifications

    • Spreads and Commissions
    • Range of Market
    • Trading Hours
    • Funding
    • Withdrawal

    About IC Markets

    • Help Center
    • Why IC Markets
    • Regulation
    • Legal Documents
    • Contact Us


    Forex Trading

    • Accounts Overview
    • Open an Account
    • Launch Web Trader

    Trading Specifications

    • Spreads and Commissions
    • Range of Market
    • Trading Hours
    • Funding
    • Withdrawal

    About IC Markets

    • Chat with a Specialist 24/7
    • Why IC Markets
    • Regulation
    • Legal Documents
    • Contact Us

    Disclaimer: This material is marketing material where all marketing material is published for informational purposes only. This material does not contain and should not be considered as containing - investment advice and recommendations, or suggestions for performing any actions with financial instruments. The built-in widgets belong to their external independent authors, and IC Markets is not responsible for their content and their impact on trade.

    All content rights reserved. Opinions of the authors may not coincide with the opinion of the blog editors. When copying materials from this site or connecting to an RSS feed to republish our articles, a link to IC Markets or attribution in the format ‘IC Markets Blog’ is required. For general questions, please contact the editorial office via the form on the Contact us page.

    Risk Warning: Trading Derivatives carries a high level of risk to your capital and you should only trade with money you can afford to lose. Trading Derivatives may not be suitable for all investors, so please ensure that you fully understand the risks involved and seek independent advice if necessary. A Product Disclosure Statement (PDS) should be considered before entering into a transaction with us.

    The contents of this page are general information only and does not take into account your personal situation, financial objectives or needs. It is up to you to make sure the products that we offer suit your specific needs. You should not trade with us unless you understand the features and risks of the products that we offer. This means that you might need to seek independent advice before you start trading with us.

    © 2022 Raw Trading Ltd | All rights reserved.
    • Sample Page